How to Measure AI Tool Adoption Across Your Company
Learn how to measure AI tool adoption across your company using passive usage data, not surveys. A practical framework for HR leaders running an AI rollout.
Six months into an AI tool rollout, leadership asks one question: is anyone actually using this? The answer determines whether you renew the license, expand the seat count, or quietly let the contract lapse.
Most companies can’t answer it. They have spend data, they have license counts, and they have a vague sense from hallway conversations. What they don’t have is real adoption data — broken down by team, by tool, and by depth of use.
This guide walks through what AI tool adoption actually means, why surveys alone produce misleading numbers, and how to build a measurement layer that runs continuously without burdening your team. If you’ve already deployed an employee AI adoption survey, this is the complementary piece: passive measurement that triangulates against the self-report data.
Why Most AI Adoption Numbers Are Wrong
Most AI adoption numbers are wrong because they come from surveys, and surveys suffer from response bias in both directions. McKinsey research found C-suite leaders estimate just 4% of employees use AI for 30% or more of their daily work, when the actual figure is roughly three times higher.
The bias runs both ways. Early in an AI rollout, employees often under-report usage because they worry it’ll be judged as cutting corners or as a security risk. Later, once leadership signals AI use is expected, the same employees over-report to look like good adopters. Neither number reflects reality.
Survey-based measurement also misses the people who matter most for ROI: the power users driving outsized productivity gains, and the no-shows who never logged in at all. Averages hide both extremes.
The third problem: surveys are slow. By the time you’ve designed the questions, deployed the survey, chased completion, and analyzed the data, three months have passed. The AI tool landscape moves faster than that.
What “AI Adoption” Actually Means
AI adoption isn’t a single metric. It’s three layered questions: who can use the tool, who does use it, and how meaningfully they use it. Mixing these together produces misleading single-number adoption rates that hide what’s actually happening across teams.
The three layers:
- Access — Who has a paid seat or login. This is your floor, not your adoption rate.
- Activity — Who logs in regularly. Weekly active users are the standard benchmark, but daily active users tell a stronger story for tools meant to be in the workflow daily (coding assistants, chat tools).
- Depth — How much work the user does with the tool. For Claude or ChatGPT, that’s messages sent and artifacts created. For Cursor, Codex, or Copilot, that’s lines accepted, sessions completed, and pull requests assisted.
A team can have 100% access, 80% weekly activity, and only 20% depth. Each layer needs to be measured separately. Gallup’s 2025 research shows the same pattern at the market level: 45% of US employees use AI at least a few times a year, but only 10% use it daily.
The Three-Layer Framework for AI Adoption Measurement
A working measurement framework tracks usage, engagement, and impact for every AI tool you’ve rolled out. Each layer pulls from a different data source, and each layer answers a different question for a different stakeholder.
Layer 1: Usage. Who is using the tool, and how often? Pull this from each tool’s enterprise analytics API. The metric to track is weekly active users as a percentage of provisioned seats, segmented by team or department.
Layer 2: Engagement. When users do use the tool, how deeply do they engage? This varies by tool category:
- Chat tools (Claude, ChatGPT): messages per active user, artifacts created, conversation depth
- Coding assistants (Cursor, Codex, Copilot, Claude Code): completions or edits accepted, lines added, pull requests assisted, session count
Layer 3: Impact. Is the tool changing how work gets done? This is the layer most companies skip, and it’s also the one finance asks about. Look at output velocity (PRs merged, tickets closed, deals moved) for users with high tool engagement versus low, controlling for role and team.
The framework matters because each layer answers a different question. Usage tells you if the rollout reached people. Engagement tells you if those people actually integrated the tool into their work. Impact tells you if any of it produced business value.
Why Passive Measurement Beats Surveys
Passive measurement pulls usage data automatically from each AI tool’s enterprise analytics API. Surveys ask employees what they did. Passive measurement reads what they actually did. For adoption tracking, passive data is closer to ground truth and produces no survey fatigue.
The honest tradeoff: surveys still capture things passive data can’t. Why someone stopped using a tool. How the tool changed their workflow. What they wish it did differently. Those qualitative signals matter, and the right answer is to run both — passive measurement for the behavioral baseline, periodic surveys for the sentiment layer.
But the behavioral baseline has to come first. If you’re trying to interpret a survey result that says “32% of marketing uses Claude weekly” without knowing whether that’s accurate, you’re guessing. Passive data anchors the conversation. Survey data adds texture.
Shadow AI makes this even more urgent. Roughly 84% of organizations discover more AI tools than expected during audits, and 8 in 10 office workers use public AI tools without IT approval. Surveys can’t catch this. License-level usage tracking can.
Pulling Usage Data from Claude, Cursor, and Codex
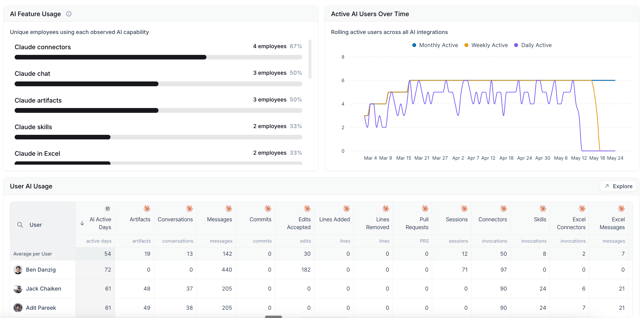
Most enterprise AI tools now expose an analytics API that lets you pull per-user usage data automatically. Anthropic’s Claude, Cursor, and OpenAI’s Codex all offer enterprise-tier analytics. The data is there. The hard part is consolidating it across tools, attributing usage to the right person, and making it consumable for managers.
A few options for how to consolidate:
- Build it yourself. Pull each API into a data warehouse, attribute to employees through your HRIS, and build dashboards in Looker or Tableau. Realistic for engineering-heavy orgs that already have a data team.
- Use a people analytics tool. Some platforms now pull AI tool usage data directly. Windmill’s AI Adoption report connects to Claude, Cursor, and Codex enterprise analytics APIs and attributes usage to each employee via your org chart. Currently in early access — book a demo to see it.
- Use IT’s existing telemetry. SSO logs and browser-extension telemetry can show login activity, though they miss depth-of-use metrics.
The integrations themselves are read-only and aggregate. Windmill’s Claude, Cursor, and Codex integrations pull usage counts and acceptance rates without touching conversation content, prompts, or code.
What to Do With the Data
Adoption data is only useful if managers act on it. The two most common patterns are coaching low-adoption users and replicating what high-adoption users do.
Coaching low-adoption users: filter to people with provisioned seats and low usage, then surface this in their next 1:1. The conversation isn’t “why aren’t you using it” — it’s “what’s getting in the way?” Often it’s training, sometimes it’s workflow fit, occasionally it’s that the tool genuinely doesn’t help them.
Replicating high-adoption users: identify your top decile by depth, ask what their workflows look like, and feed those patterns back to the rest of the team. This is where most of the productivity gains come from in any tool rollout. Enterprise data shows AI-using developers save an average of 3.6 hours per week with the top 20% saving 8 hours or more.
For a deeper look at how to act on adoption data through your existing management infrastructure — recognition, 1:1s, performance reviews, and accountability dashboards — see our companion piece on measuring and driving AI adoption.
The AI Adoption report also feeds directly into performance reviews when AI usage is part of how an employee gets their work done. Reviews that ignore AI-assisted output increasingly miss how modern work actually happens.
Common Mistakes to Avoid
A few patterns to avoid as you build out measurement:
- Treating “active” as a single metric. Weekly active is not the same as daily active. For coding assistants, daily is the right bar. For chat tools used for occasional research, weekly is fine.
- Comparing across roles. A 90% Claude adoption rate in marketing means something different than 90% in legal. Segment by function before comparing.
- Naming and shaming low adopters in dashboards. Adoption dashboards should be tool-level by default, individual-level only for the person’s manager. Public ranking creates the wrong incentive.
- Skipping outcome measurement. Activity without outcomes is theater. If a tool has high engagement and zero downstream impact on output, the right call may be to cut it.
- Measuring once. AI adoption curves move fast. Static snapshots become stale within weeks. Trend lines matter more than point-in-time numbers.
The Bottom Line
Every company in 2026 has an AI strategy. Most don’t have an AI measurement strategy, which is why Forrester’s 2026 research found fewer than one in three AI decision-makers can tie AI value to P&L changes. The gap isn’t analytical sophistication — it’s data infrastructure.
Passive usage data is the foundation. Layer surveys on top for sentiment, but anchor the conversation in what people actually do. The companies that get this right in 2026 will be the ones expanding their AI footprint with confidence. The ones still relying on quarterly surveys will be the ones renewing licenses on faith.
Ready to measure AI adoption with real usage data? Windmill’s AI Adoption report pulls live data from Claude, Cursor, and Codex. Book a demo to see it.
Frequently Asked Questions
How do you measure AI tool adoption across a company?
Measure AI tool adoption by pulling usage data directly from each tool's enterprise analytics API rather than relying on self-reported surveys. Track three layers: who has access, who actually uses the tool regularly, and what depth of engagement they show (sessions, acceptance rates, output produced).
What's the difference between active and passive AI adoption measurement?
Active measurement asks employees to self-report through surveys. Passive measurement pulls real usage data from each AI tool's enterprise API automatically. Passive data shows what people actually do, while surveys show what people think they do — the two answers can differ by 3x or more.
Why aren't AI adoption surveys enough?
Surveys suffer from response bias in both directions. Employees may under-report AI use if they fear it'll be judged, or over-report once leadership signals AI use is expected. McKinsey research found C-suite leaders underestimate employee AI use by roughly 3x. Surveys alone produce a measurement gap that compounds the longer the rollout runs.
How long does it take to see ROI from an AI tool rollout?
Most enterprises report positive ROI within three to six months when they have measurement infrastructure in place from day one. Without measurement, ROI conversations stall — Forrester's 2026 research found fewer than one in three AI decision-makers can tie AI value to P&L changes.
Which AI tools should HR track for adoption?
Track whatever your company has rolled out and paid for. The most common enterprise AI tools in 2026 are Claude, ChatGPT, GitHub Copilot, Cursor, and Codex. For developer-heavy organizations, coding-assistant adoption is often the highest-stakes line item — both for productivity gains and license cost recovery.